Know about a problem in your field before it becomes a loss

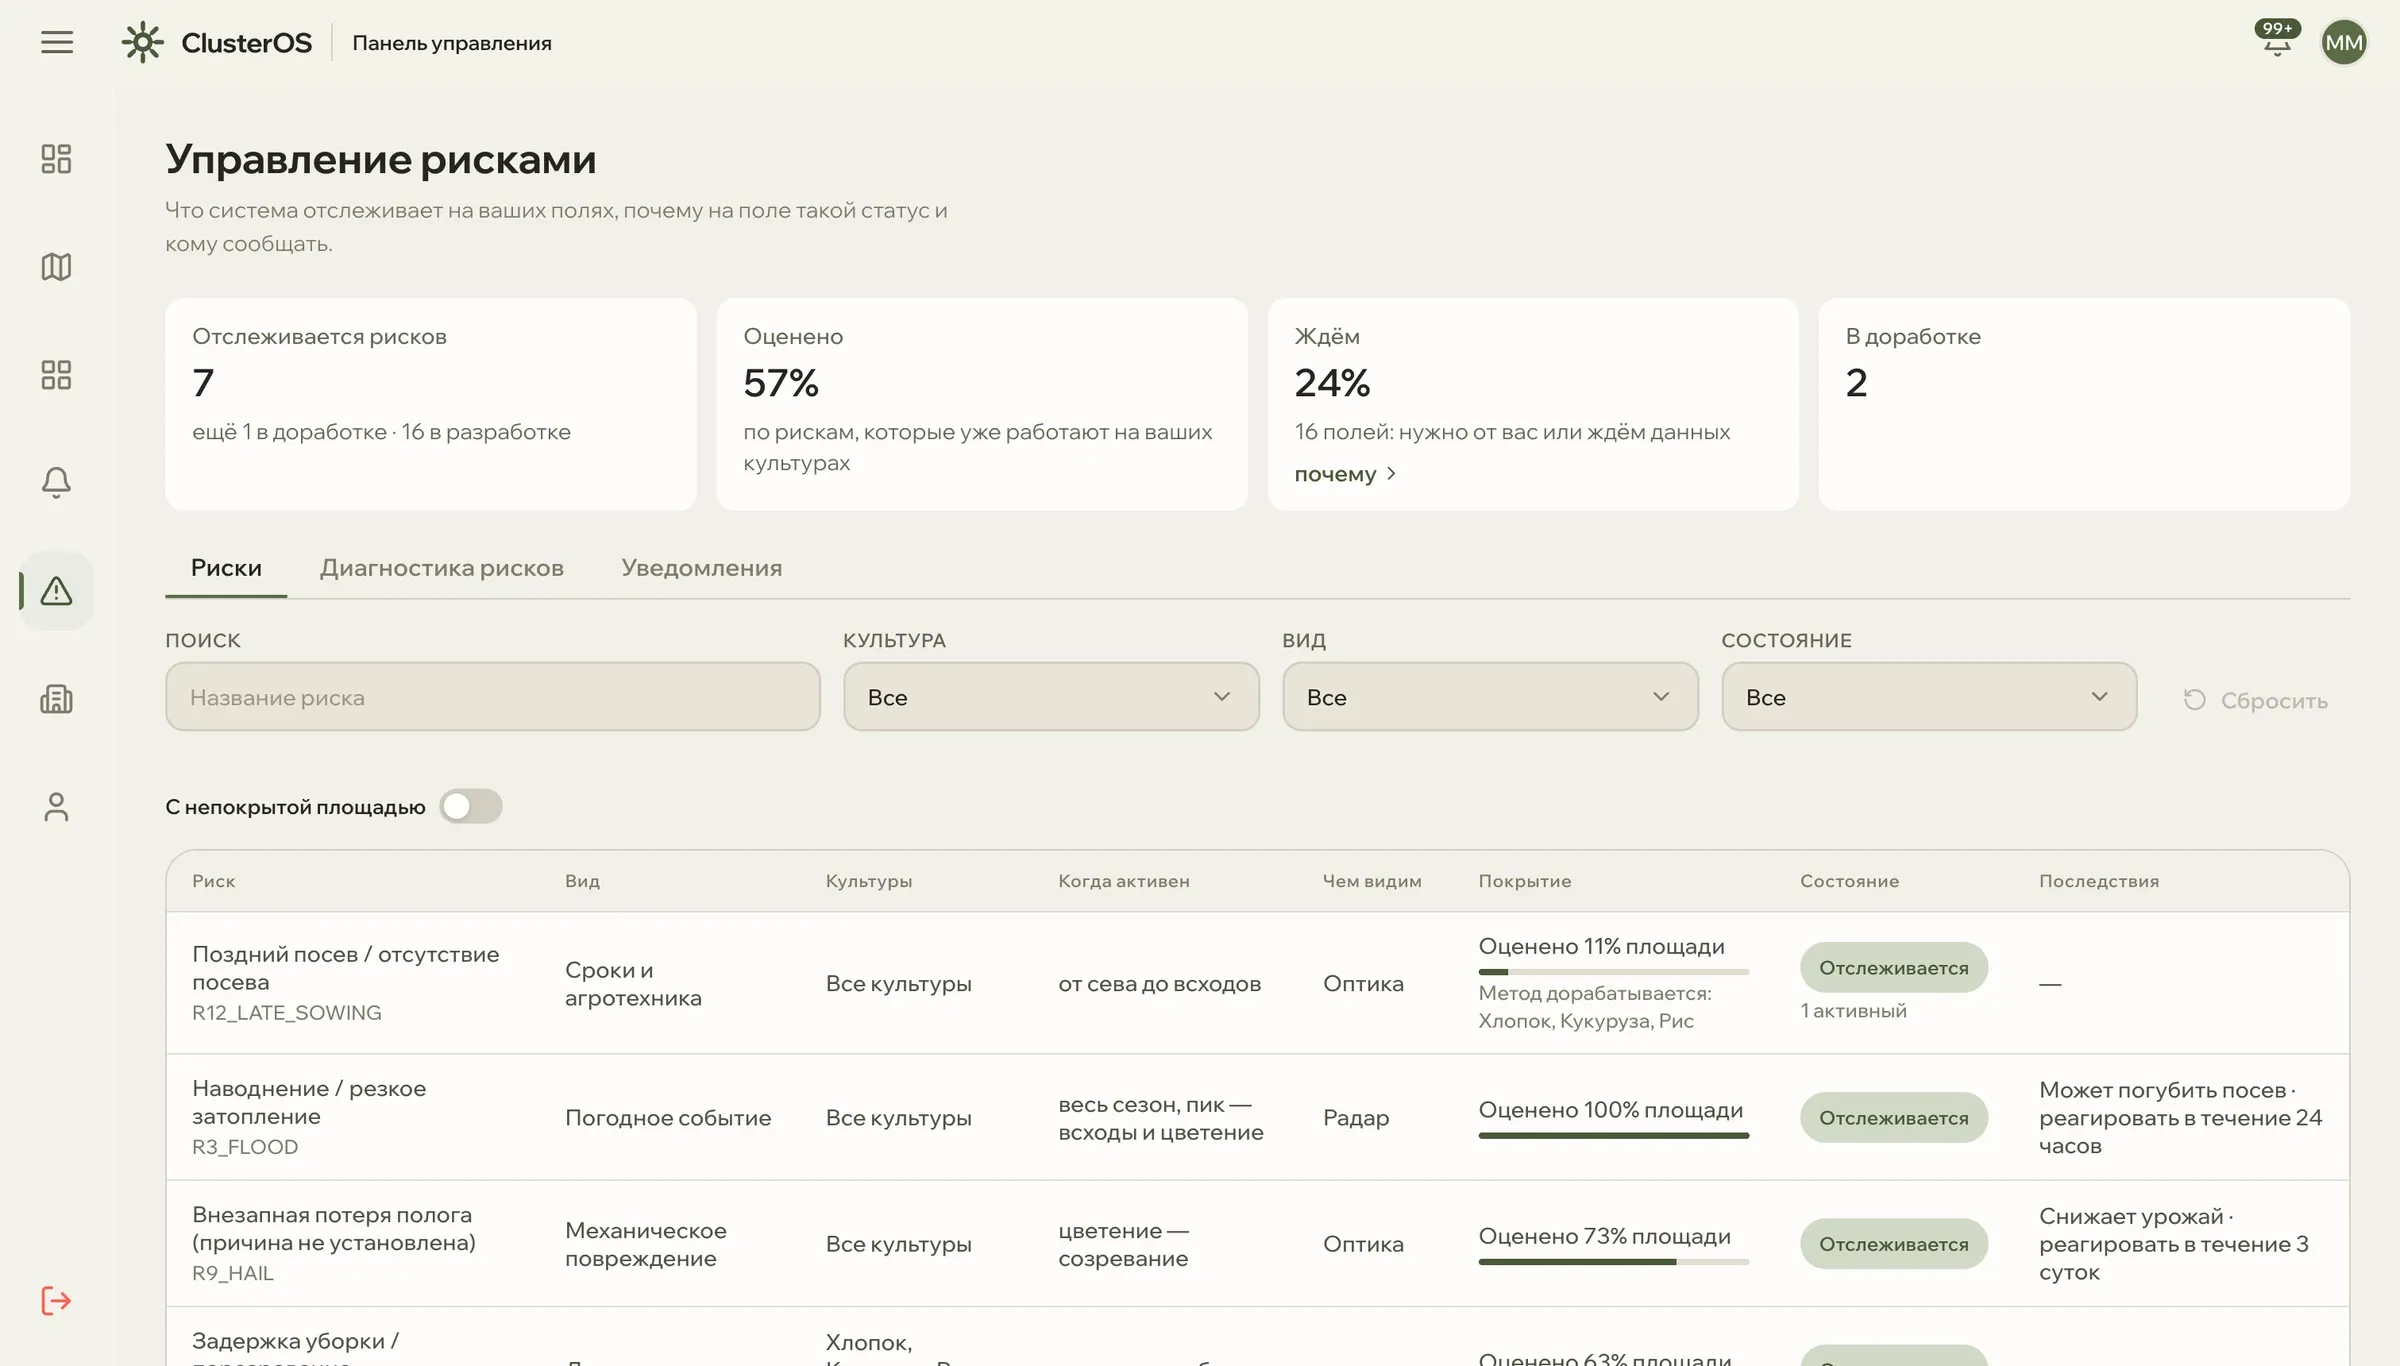
ClusterOS tracks 24 risks on every field and tells you in Telegram, in advance, what threatens it, why and what it will cost.

How it works

What your team sees

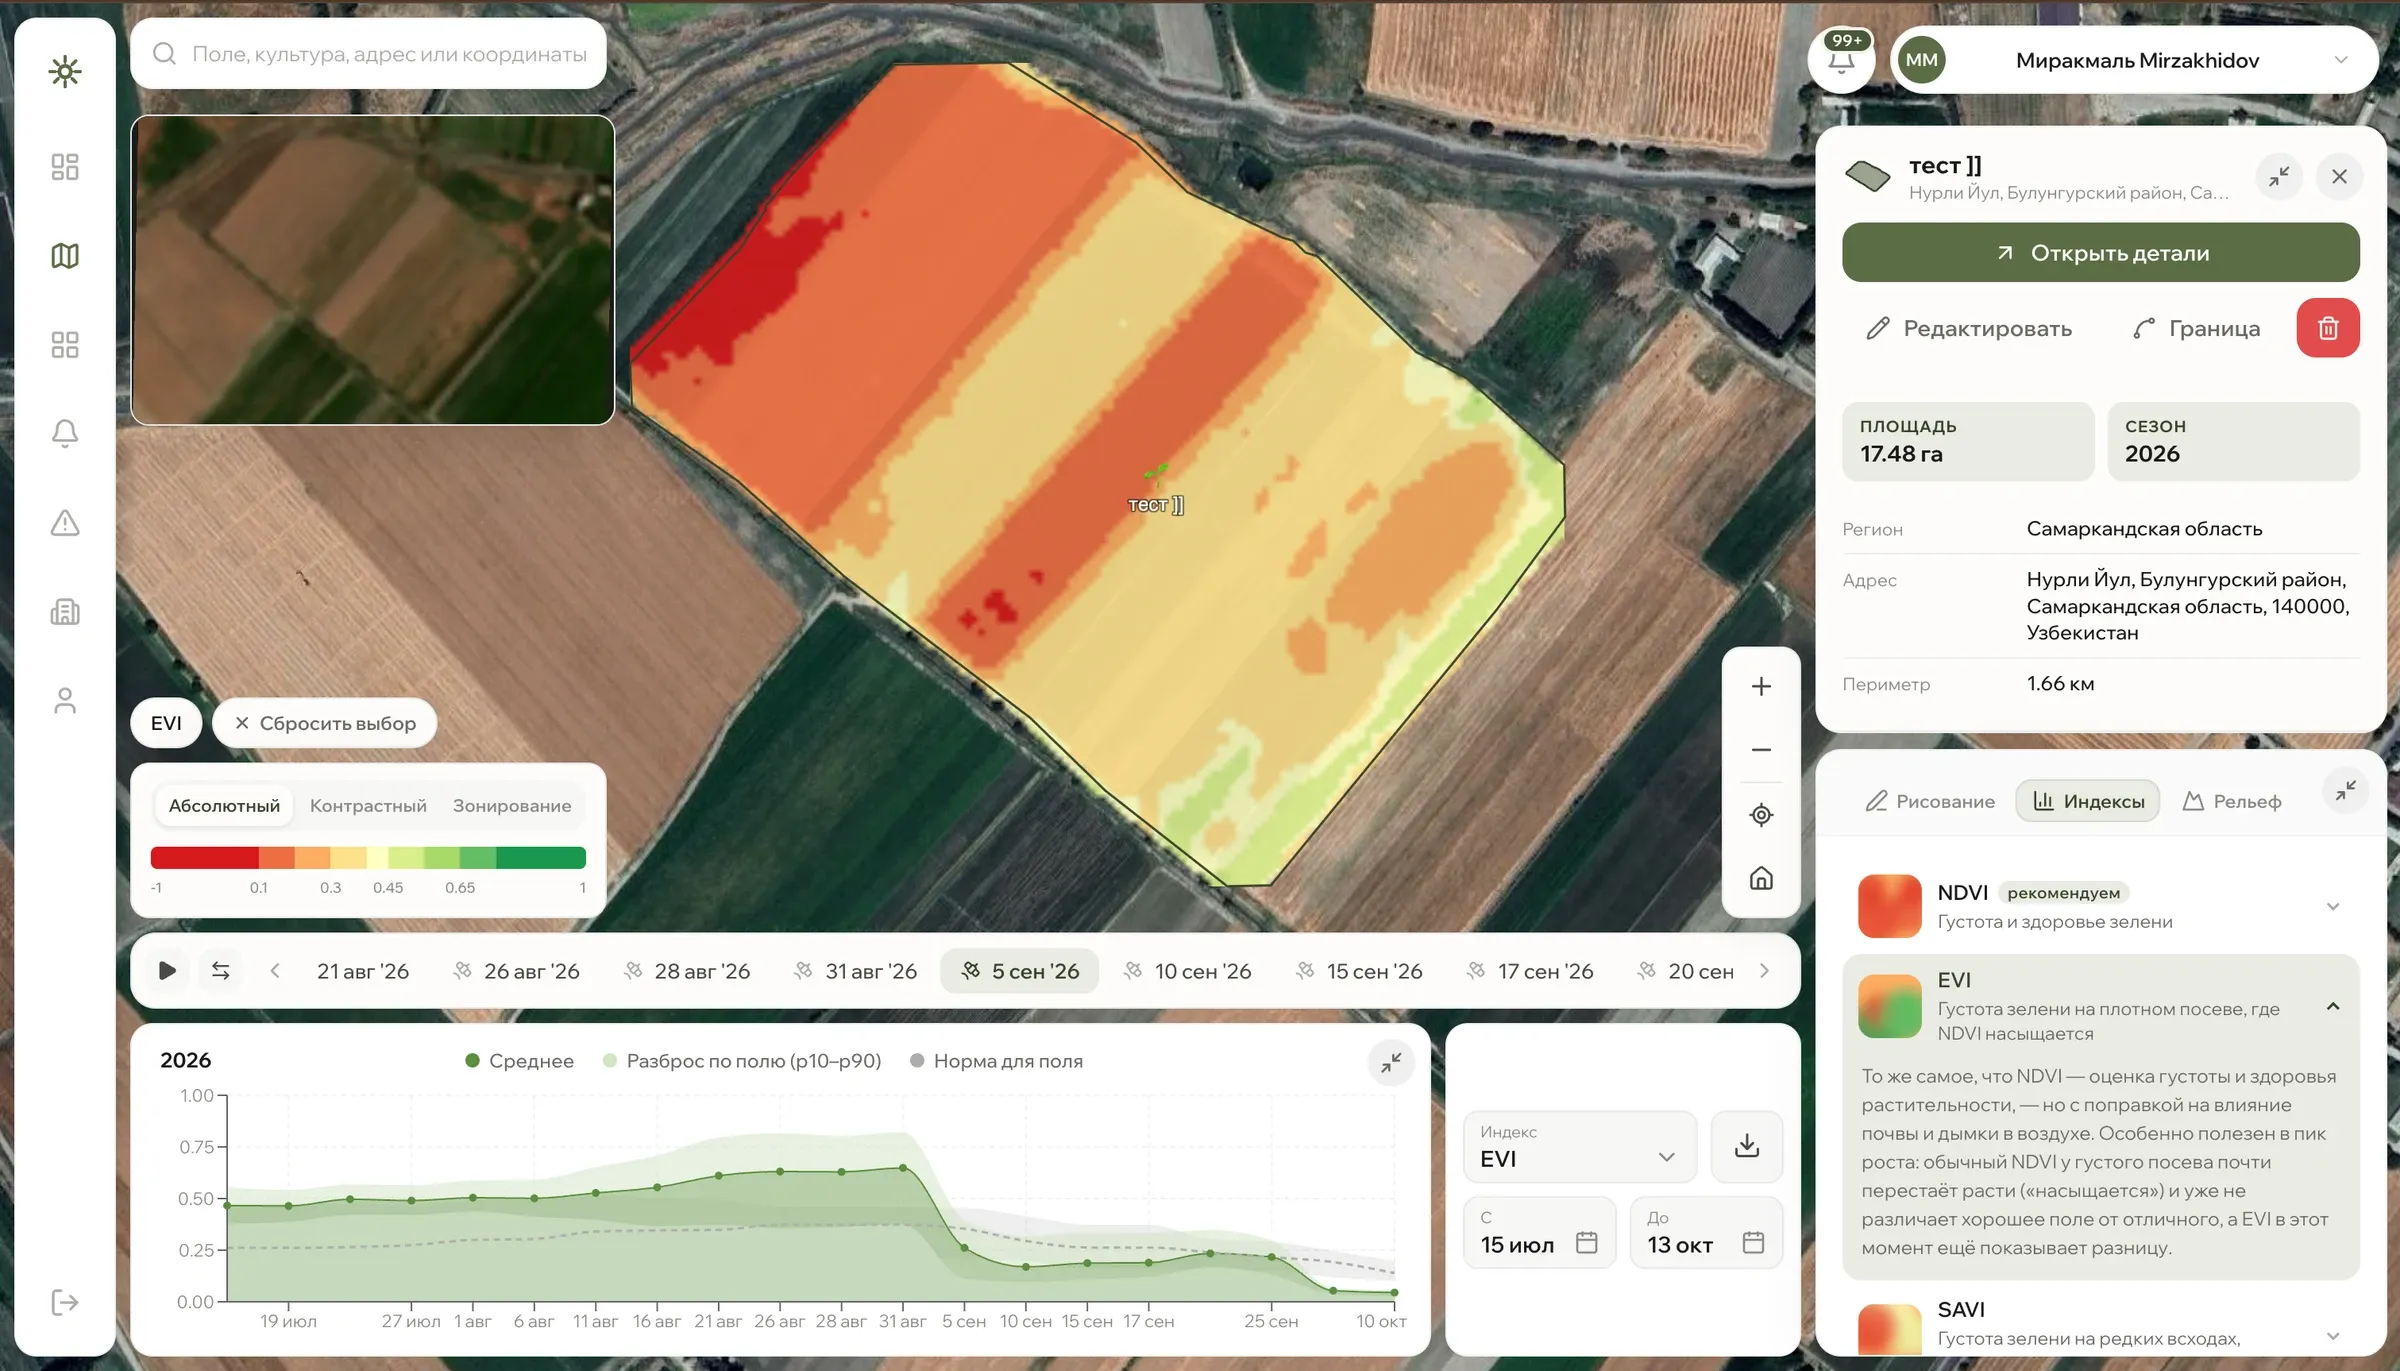
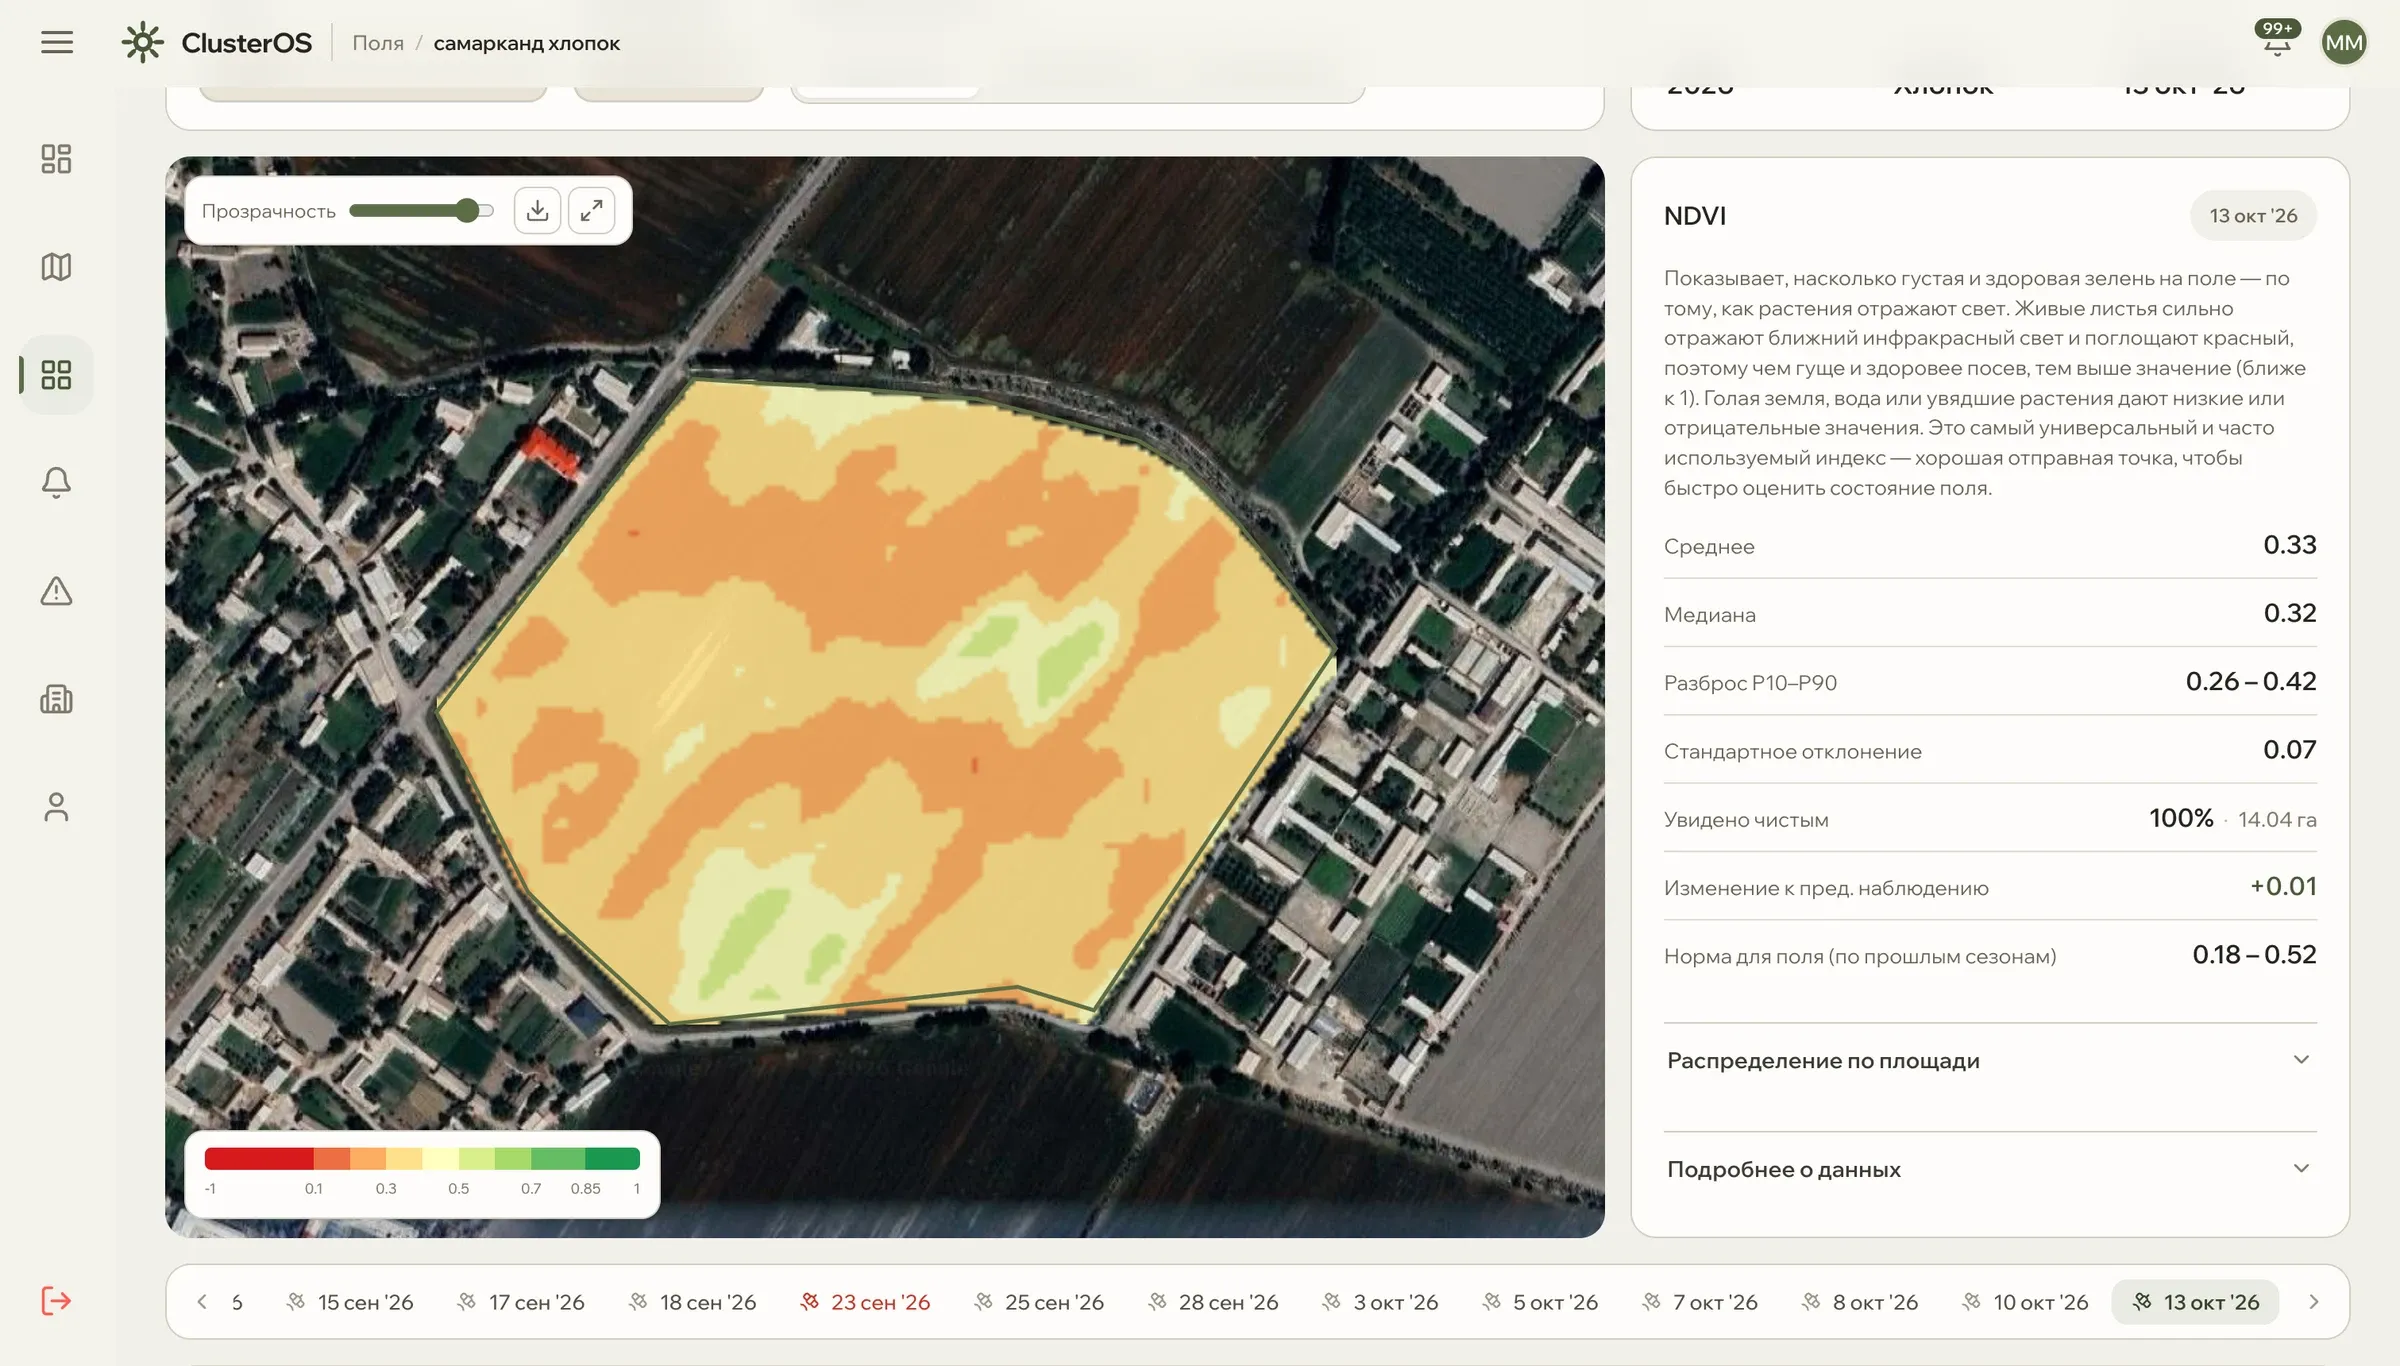
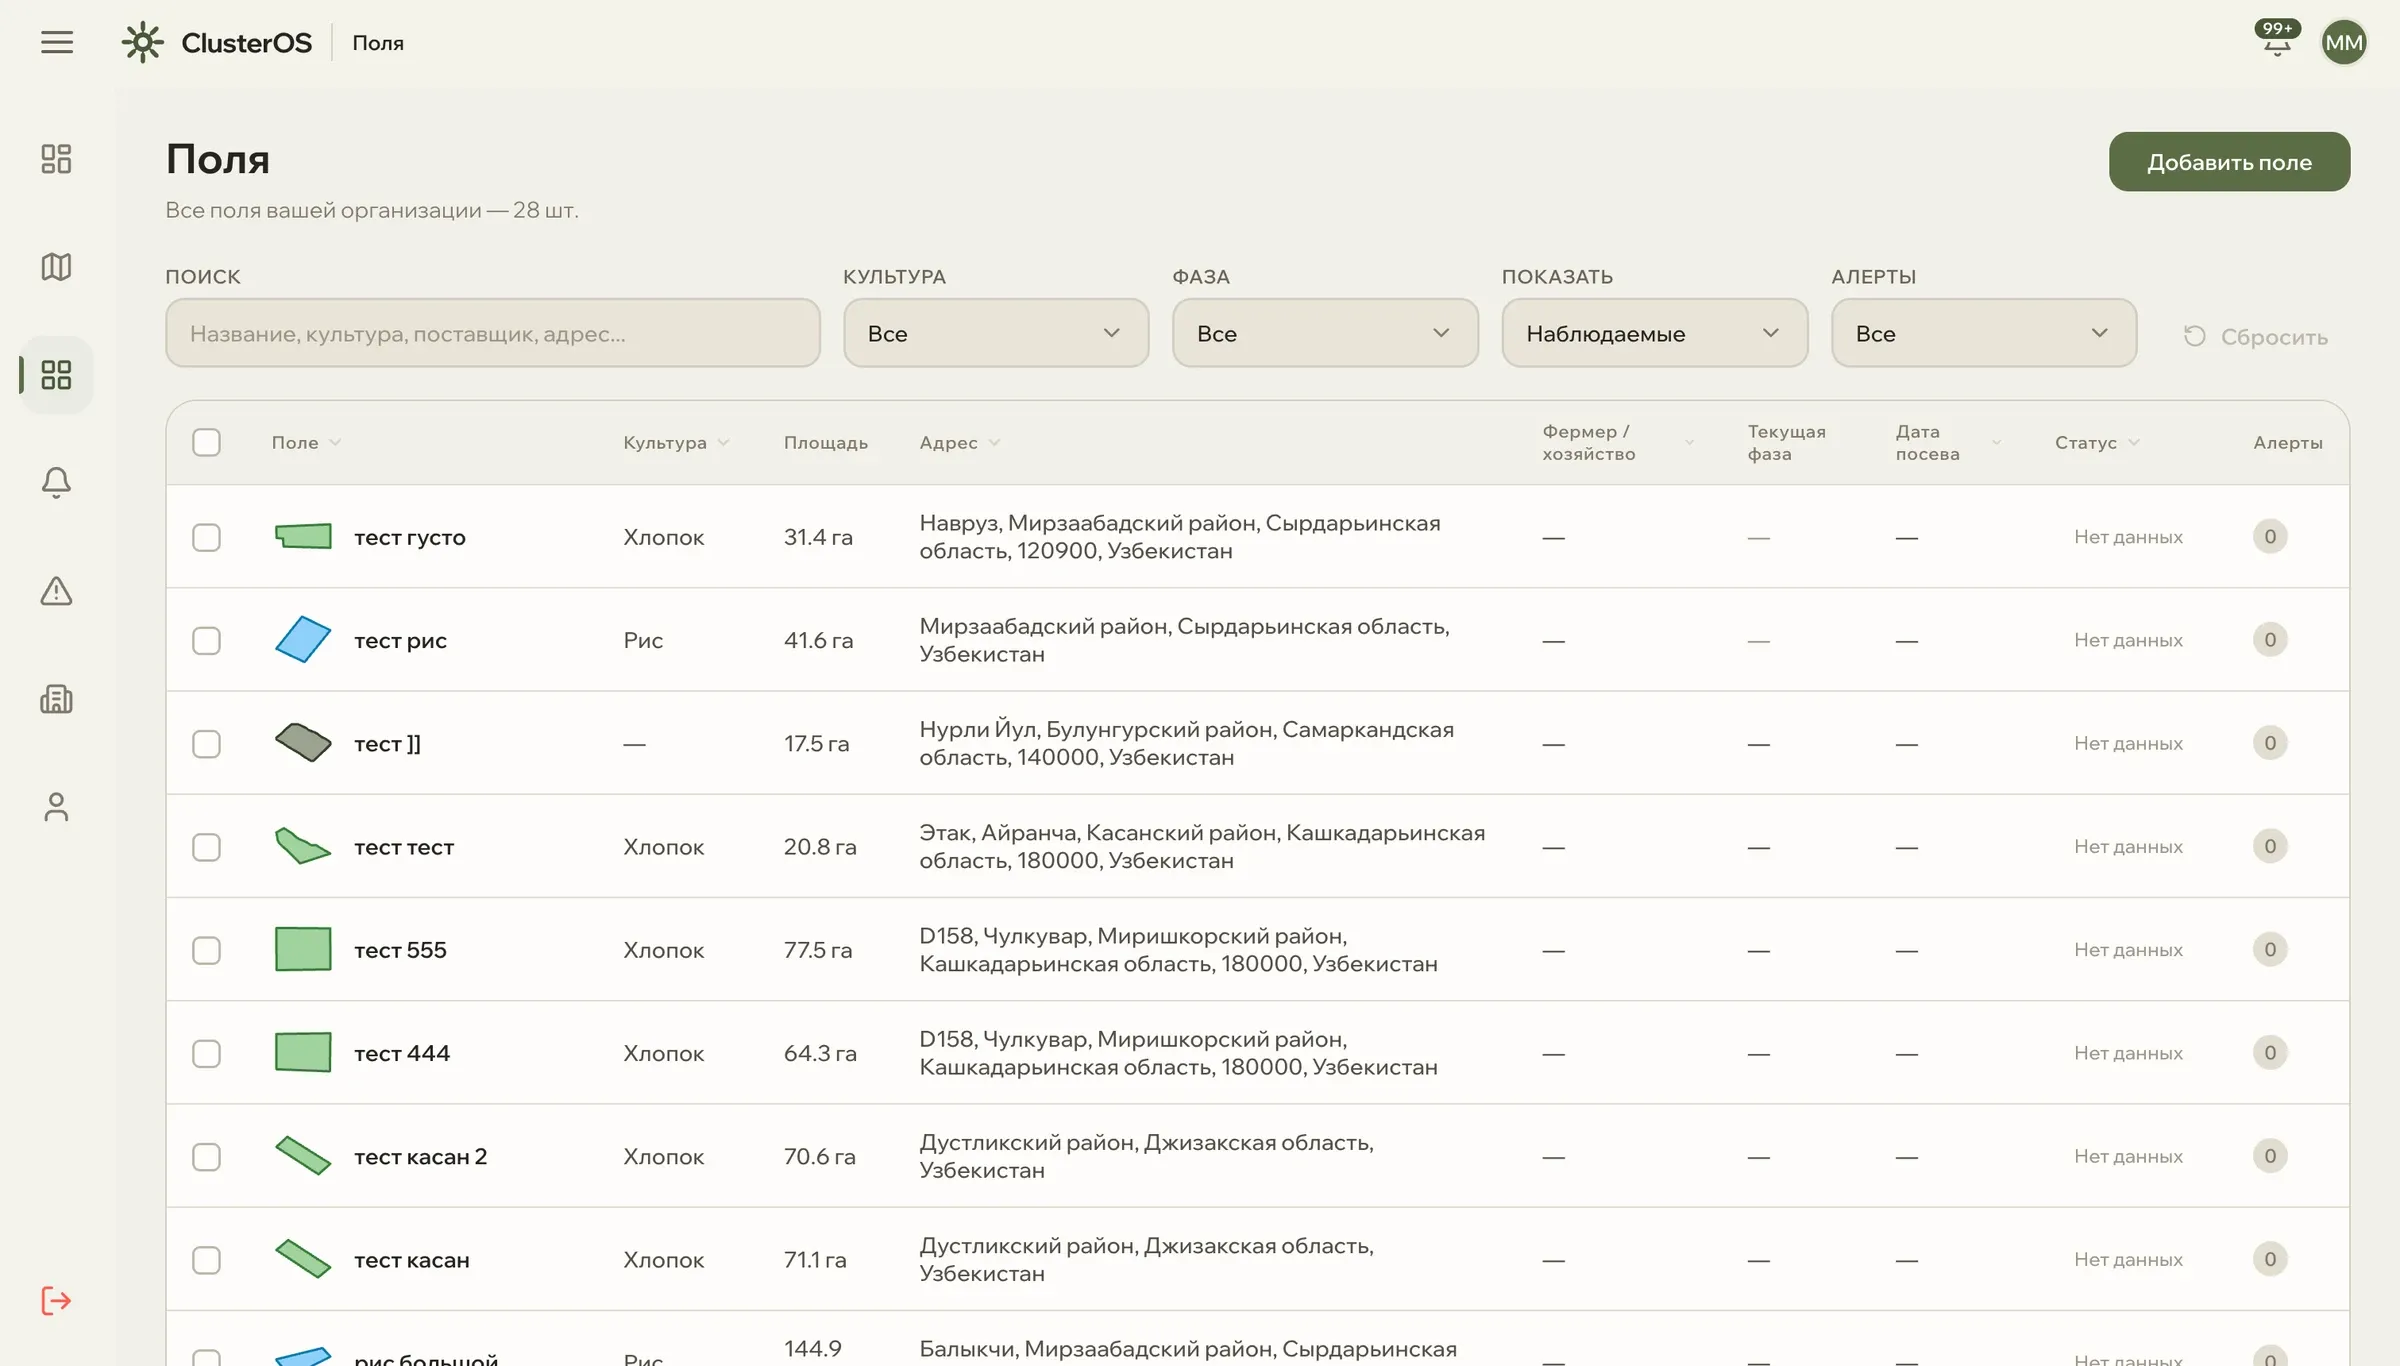
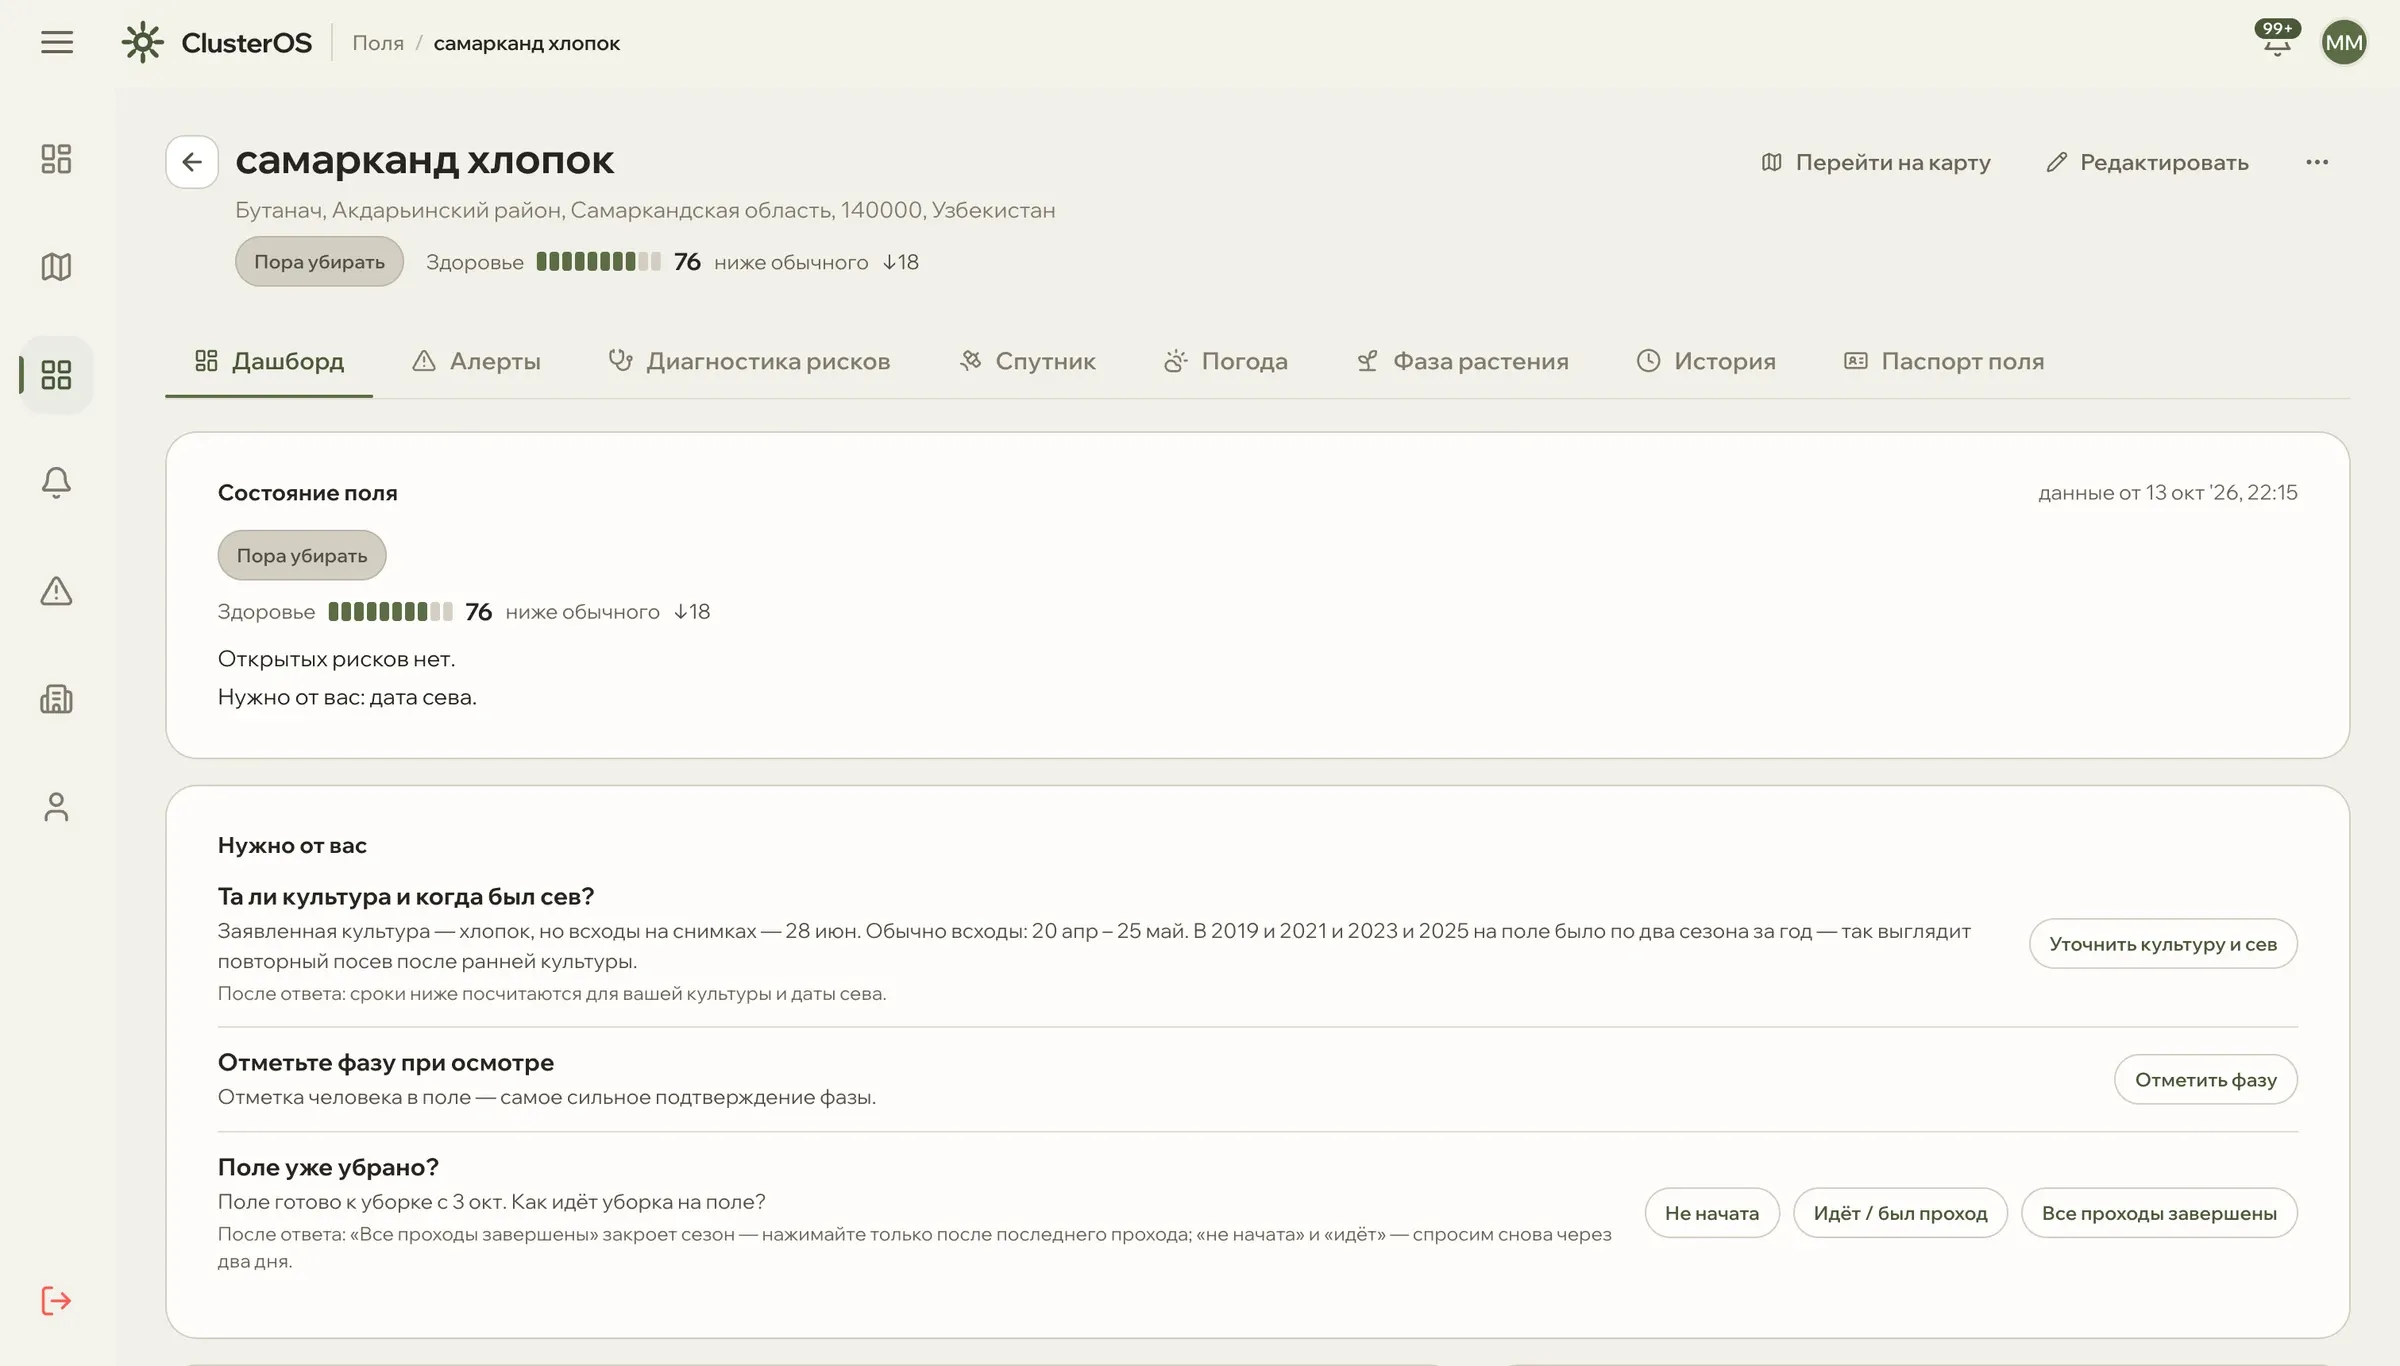
Real ClusterOS screens on test fields: from the map to a decision on a specific field.

24 risks on every field

The same drought costs differently at flowering and at ripening – the system accounts for the crop stage.

Water3
  • Water stress

    The crop is short of water. Imagery and the forecast show it before the leaves start to wilt.

  • Waterlogging

    Water stands after irrigation or rain – roots suffocate and plants fall behind.

  • Flooding

    The field or part of it is under water. The area and date are recorded – for decisions and insurance.

Weather7
  • Hot dry wind (garmsel)

    A hot dry wind dries out crops within days. We warn from the weather forecast.

  • Heat stress

    Heat above the crop’s threshold at a sensitive stage cuts the yield.

  • Spring frost

    Frost at emergence or flowering. The warning comes in advance, with time to protect the crop.

  • Winterkill

    Hard frost without snow cover is dangerous for winter wheat – we watch the field all winter.

  • Hail

    Hail from the forecast – a warning before the event, and images of the field before and after it.

  • Wind lodging

    Strong wind flattens crops before harvest. We show the fields where the risk is higher.

  • Dust storms

    Dust damages leaves and young seedlings. We warn from the forecast.

Crop development6
  • Late sowing

    Sowing after the best window for the region. Every week of delay costs part of the yield.

  • Poor emergence

    Seedlings are sparse or uneven – it shows in imagery in the first weeks.

  • Development lag

    The field develops more slowly than in its own past years and than neighbouring fields at the same stage.

  • Anomalous dynamics

    The crop changes unlike what is usual for this crop and stage – a reason to check the field.

  • Low expected yield

    The expected yield is below plan – you see how many tonnes are at risk.

  • Harvest delay

    The field is ripe but harvest has not started. Losses grow every week, and the next sowing slips.

Soil and nutrition4
  • Salinity

    Salt rises to the surface on irrigated land – we find the problem parts of the field.

  • Soil alkalinity

    Alkaline soil keeps plants from taking up nutrients – such fields are flagged.

  • Nutrient deficit

    Imagery shows signs of nutrient shortage – it is clear where top dressing is needed.

  • Chlorosis

    Leaves turn yellow on part of the field – noticed earlier than on a field round.

Field management4
  • Abandoned field

    The field is listed as sown, but there are no signs of work on it.

  • Rotation breach

    One crop stays on the same field too long – diseases rise and yield falls.

  • Missed field operations

    Work on the field is behind the region’s crop calendar.

  • External damage

    Damage from machinery, livestock or other external causes.

What a delay costs

1 000 ha of cotton got a fifth less water during flowering

≈ 455 t of raw cotton≈ 3.55 bn sum

Spot it earlier and cut the deficit to 5% – the loss is ≈ 114 t. The difference is 341 t, or ≈ 2.66 bn sum.

How it is calculated
  • Yield loss = Ky × (1 − share of water received). Ky for cotton at flowering is 0.5 (FAO, Irrigation and Drainage Paper 33): 0.5 × 0.2 = 10%.
  • Yield 4.55 t/ha (Ministry of Agriculture, 2025): 4 550 t × 10% = 455 t.
  • Price 7.8 m sum per tonne – the 2024 harvest starting price (Spot.uz).

This is the cost of the problem, not a promise of results.

Who ClusterOS helps

How many tonnes of the plan are at risk – by every farmer and field.

A cluster answers for contracted volume across thousands of hectares. ClusterOS gathers the risks of every field in one Control center and shows where, and how many tonnes, are at risk.

  • All 24 risks on every field
  • Tonnes and sums at risk against the plan
  • Agronomists go only where they are needed

You learn about drought, frost and hail in Telegram before you see them in the field.

Without an agronomy department of your own, what matters is learning about a problem while it can still be fixed. The alert arrives in Telegram – with the cause and what to do.

  • Weather threats from the forecast
  • The crop stage of every field, no site visits
  • Loss estimate for your own area

What happened, when and where – with images of the field before and after.

Verify a claim without sending an expert to every field: the event, its date, the field outline and its history in one package.

  • Hail, flooding, lodging, hot dry wind
  • Field images before and after the event
  • The history of every field since 2019

How much raw material your suppliers will deliver – in advance.

With your suppliers’ consent, view their fields: crop condition and risks for each of them, long before harvest.

  • Cotton, wheat and rice
  • Risks for every supplier
  • Supplier reliability from field history

How many hectares of the district face which risk – from the forecast.

The risk picture for a district: drought, hot dry wind, frost – before they turn into losses. Not a check on reporting, but early warning.

  • District risk summary
  • Forecast of weather threats
  • Data on every field

How to start – no sensors, no site visits

  1. Upload your field outlines or draw them on the map.

  2. Set the crops – the history and stage of every field appear right away.

  3. Receive alerts in your account and in Telegram.

Questions

How are you different from other monitoring systems?

A typical system shows a map. ClusterOS tracks 24 risks on every field and tells you in advance what threatens it, why, what it will cost and what to do. It is built for the crops and growth stages of Uzbekistan, and alerts arrive in Telegram in your language.

Do we need sensors or equipment?

No. All you need are the field outlines and the crop.

Where does the data come from?

The Copernicus Sentinel-1 and Sentinel-2 satellites, Landsat and ERA5 weather with a forecast – open data used by researchers around the world.

What if the field is covered by clouds?

We never pass guesses off as data: if there is no observation, the system says so. Weather risks – frost, hail, hot dry wind – come from the forecast and do not depend on clouds.

How accurate is it?

Risk thresholds come from scientific sources, including Central Asian ones. Every alert has a cause and a confidence level: the agronomist sees what the signal is based on and decides. A false alarm can be marked, and the system takes it into account.

Do we still need agronomists?

Yes, but fewer. The agronomist goes where the system has found a problem and covers more fields. A calculation on your figures shows how much you will save.

Who sees our data?

Only your organization. Access is set by roles. You can open a view-only access for a buyer or an insurer yourself. Details are in the privacy policy.

How much does it cost?

The price depends on the area and your tasks. Leave a request – we will calculate it for your farm.

Let’s look at your fields together

We will show what ClusterOS sees on your fields and calculate the losses on your figures.

or Message us on Telegram

Request a demo

We will call or message you in Telegram and show ClusterOS on your fields.

Who you are

Request a demo

We will call or message you in Telegram and show ClusterOS on your fields.

Who you are